[Record to Report]
Map once. Report every period.
Statements and notes fill themselves, in any GAAP.
Platform
All nine modulesSide by side, with screensAI capabilitiesAssists, with reviewIntegrationsERPs, banks, inboxesSecurity and trustControls and dataRecord to report
Financial reporting Statements and notesClose management
 Checklist and reconciliationsAccounting schedules
 Leases, assets, debt, EPSCompliance and standards
 Standards tracker and leases
Treasury and operations
Treasury and FP&A Cash, forecasts, budgetsOrder to cash
 Credit to cashProcure to pay
 Invoice to payment
By role
By reporting framework
Guides
Worked exampleA group consolidated, step by stepCapability storiesHow we handle the hard partsGlossaryFinance and GAAP terms explainedStandards
IFRS 18 hubThe new P&L, for every frameworkStandards coverageIFRS, US GAAP, Ind AS, SFRS(I)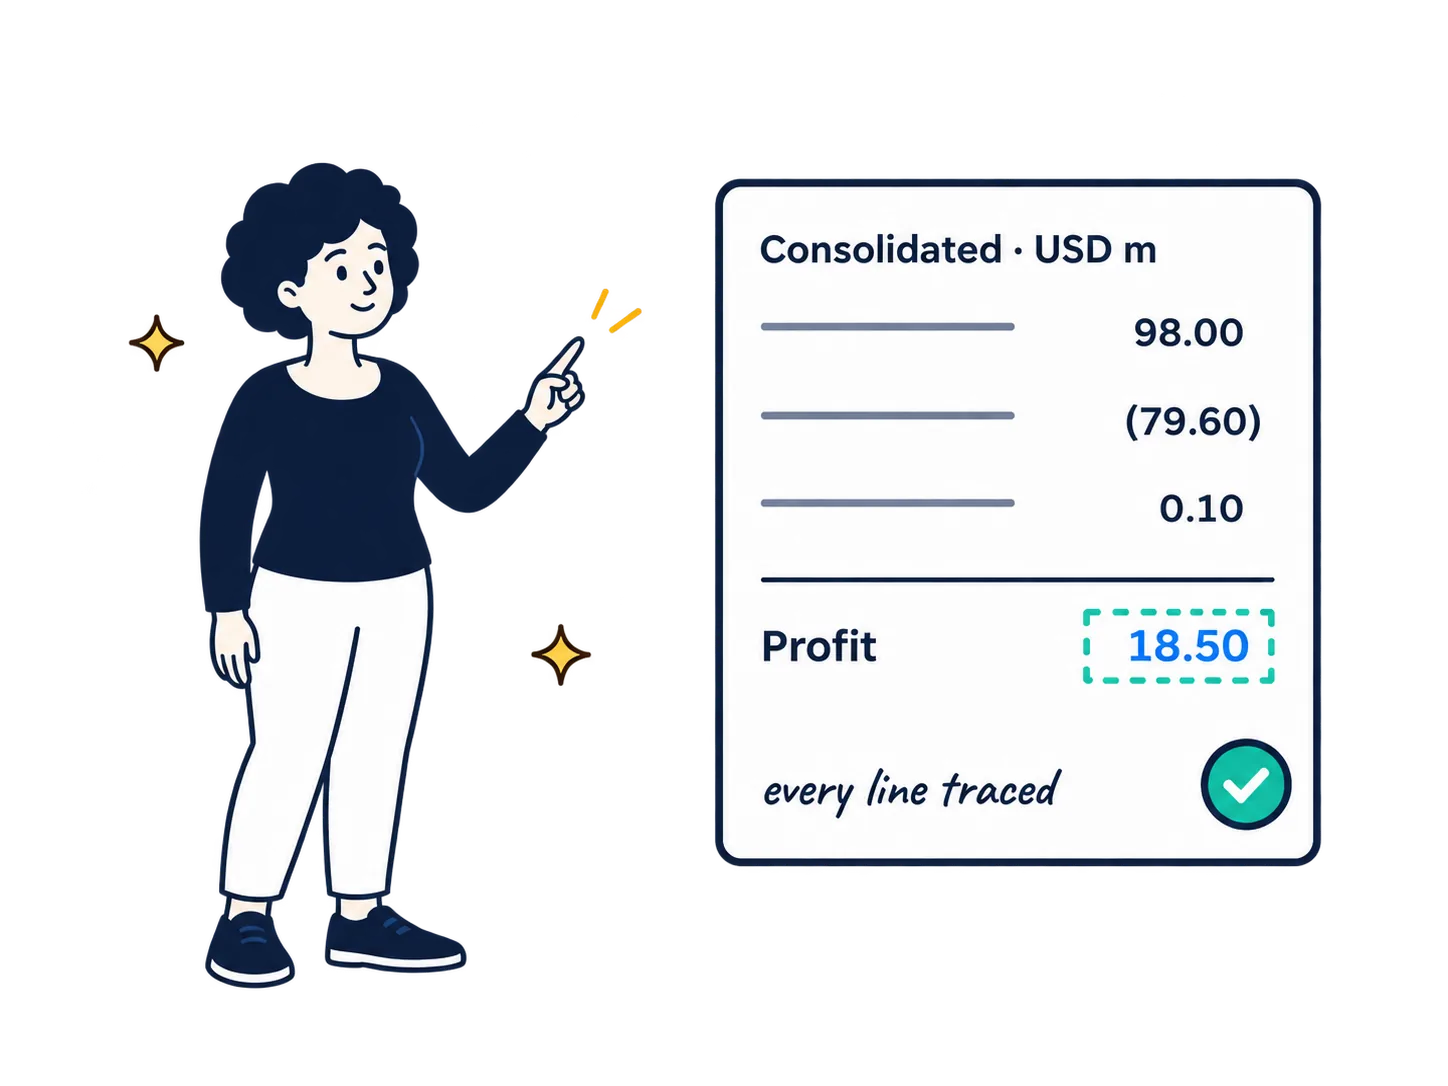 2027IFRS 18, Ind AS 118 and SFRS(I) 18 change the P&L, and your comparative year may already be running.See what changes for your framework
Consolidated statements and notes, in any GAAP.
AR, AP and treasury on the same platform.
Every number traceable. Every AI action approved. Works alongside your ERP.
[Record to Report]
Statements and notes fill themselves, in any GAAP.
[Order to Cash]
Collections ranked by risk, cash matched on arrival.
[Procure to Pay]
Captured, PO-matched and approved before the payment run.
[Treasury & FP&A]
Cash, budgets and covenants on the same numbers.
Statements and notes under every major framework, with multi-GAAP consolidation built in
Built around consolidation
Entity trial balances to group statements, in one controlled flow.
| Entity | Currency | Framework | Accounts | Mapped | Status |
|---|---|---|---|---|---|
| Apex Holdings Inc. | USD | US GAAP | 142 | 142 | ✓ |
| Apex India Pvt Ltd | INR | Ind AS | 386 | 386 | ✓ |
| Apex Asia Pte Ltd | SGD | SFRS(I) | 211 | 209 | 2 to map |
| Balance | Counterparties | Parent | Subsidiary | Difference | Status |
|---|---|---|---|---|---|
| Management fees | Parent ↔ India | 1.80 | 1.80 | 0.00 | ✓ |
| Management fees | Parent ↔ Asia | 1.20 | 1.20 | 0.00 | ✓ |
| Receivable / payable | Parent ↔ India | 0.30 | 0.30 | 0.00 | ✓ |
| Receivable / payable | Parent ↔ Asia | 0.40 | 0.38 | 0.02 | Review |
Elimination entries · USD m
| Rate per USD | Opening | Average | Closing |
|---|---|---|---|
| INR | 82.00 | 83.00 | 84.00 |
| SGD | 1.36 | 1.35 | 1.30 |
| NCI in Apex Asia (20%) · USD m | Amount |
|---|---|
| Opening NCI | 7.15 |
| Share of profit (20% of 6.50) | 1.30 |
| Share of translation difference | 0.38 |
| Closing NCI | 8.83 |
| Translation reserve · USD m | India | Asia |
|---|---|---|
| Opening net assets at opening rate | 70.85 | 35.74 |
| Profit at average rate | 10.00 | 6.40 |
| Translation difference | (1.80) | 1.89 |
| Closing net assets at closing rate | 79.05 | 44.03 |
Select a line to see where it came from.
| Consolidated income statement · US GAAP | USD m |
|---|---|
| 98.00 | |
Apex Holdings Inc.3.00 Apex India Pvt Ltd · INR 4,150.0 at 83.0050.00 Apex Asia Pte Ltd · SGD 64.80 at 1.3548.00 Elimination E1 · management fees(3.00) | |
| (79.60) | |
Apex Holdings Inc.(1.00) Apex India Pvt Ltd · INR 3,320.0 at 83.00(40.00) Apex Asia Pte Ltd · SGD 56.16 at 1.35(41.60) Elimination E1 · management fees3.00 | |
| 0.10 | |
Apex Asia: SFRS(I) 16 cost 1.20 replaced by ASC 842 lease cost 1.100.10 | |
| Profit for the period | 18.50 |
| Attributable to owners of the parent | 17.20 |
| Attributable to non-controlling interest | 1.30 |
| Translation differences (OCI): India (1.80), Asia 1.89 | 0.09 |
| Total comprehensive income | 18.59 |
| Owners 16.91 · NCI 1.68 | |
The problem
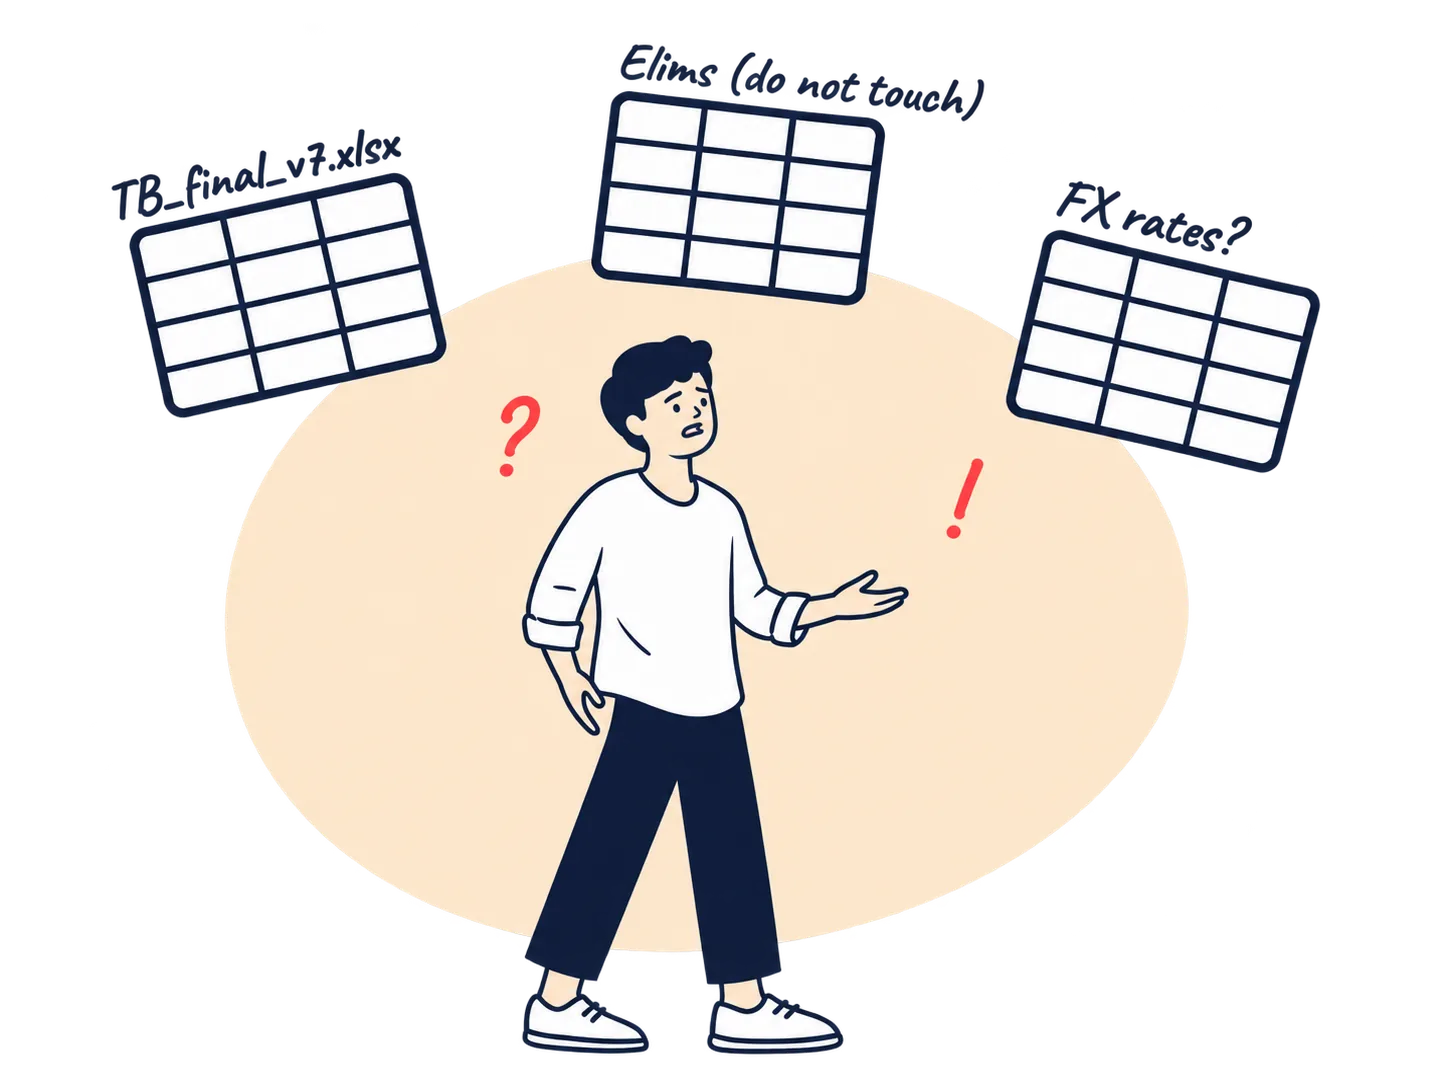
FinConso brings these activities into one controlled consolidation workflow, with defined mappings, approval controls and traceable calculations.
See how it works →
Trial balances arrive in different formats, so mapping and adjustments are repeated every period.
FinConso: Each trial balance is mapped to the group chart once, and the mapping is versioned.

Teams spend days finding mismatches and preparing elimination entries by hand.
FinConso: Balances are matched by counterparty, differences flagged with the likely cause, and eliminations generated for review.

Rates, the translation reserve and NCI need separate workings and their own reconciliation.
FinConso: Rates are held at GL level and locked; the translation reserve and NCI are calculated entity by entity.

Every reported balance is traced back to source records and schedules, again, for every audit request.
FinConso: Every consolidated line traces to the entity, the exchange rate and the elimination behind it.
How it works
Entity hierarchy, ownership, currencies, frameworks and consolidation rules, held by period.
From your accounting systems by connector, or by upload template.
Run the consolidation, inspect exceptions, review adjustments and approve.
Consolidated statements and schedules, linked to the records behind them.
The nine modules
Our logo is the platform: nine tiles, nine modules. Consolidation is where most groups start. The teal centre is Comply & AI, the module that runs standards tracking and the AI agents used across the others, with your team approving every action. Screens show sample data; in the demo, you see the live product.
| Entity | NCI % | Opening | Profit | OCI | FCTR | Closing |
|---|---|---|---|---|---|---|
| Middle East FZE 60→76% 14 Aug | 24% | 1,012.4 | 142.6 | (4.1) | (64.7) | 1,086.2 |
| Europe Ltd | 49% | 2,071.3 | 318.4 | (11.7) | 34.9 | 2,412.9 |
| Engineering GmbH | 59.2% | 603.8 | 96.1 | (1.2) | 5.8 | 704.5 |
| Total NCI | 3,687.5 | 557.1 | (17.0) | (24.0) | 4,203.6 |
Change a shareholding mid-year and the consolidation picks it up from that date. Each GL carries its own rate type, so the translation reserve is calculated and provable, not a balancing figure.
Group structure, eliminations, translation and NCI, from one definition of the group.
14. Trade receivables. Trade receivables of the Group as at 30 September 2026 amount to $ 9,184.6k, of which $ 1,206.3k is outstanding for more than six months from the due date. The Group holds an allowance for expected credit loss of $ 342.8k, determined using a provision matrix.
Post a late journal and the note updates with it. Choose the cash flow model that fits, format the pack to house style, and download it with live formulas.
Statements, notes and filings that stay tied to the ledger.
| Account | GL $'000 | Support | Preparer | Reviewer |
|---|---|---|---|---|
| Bank A current account | 1,211.95 | 1,211.95 | Signed | Signed |
| Prepaid expenses | 86.30 | 86.30 | Signed | Pending |
| Intercompany: Asia Pacific | 642.10 | 639.85 | Diff 2.25 | Waiting |
| Unbilled revenue | 318.40 | 318.40 | Signed | Signed |
| GST input credit | 74.62 | – | Not started | Waiting |
Every entity and period runs to a checklist with owners, due dates and sign-off. Each balance sheet account is reconciled to its detail, and the evidence sits in the repository.
A close that runs to a checklist, with every balance reconciled and signed.
| Class | Opening | Additions | Disposals | Depreciation | Closing |
|---|---|---|---|---|---|
| Plant and machinery | 8,412.6 | 1,204.3 | (96.4) | (512.8) | 9,007.7 |
| Buildings | 5,118.0 | 212.5 | – | (84.6) | 5,245.9 |
| Computers | 642.1 | 188.9 | (21.3) | (146.2) | 663.5 |
| Capital work in progress | 1,380.4 | 964.0 | (1,204.3) | – | 1,140.1 |
| Total | 15,553.1 | 2,569.7 | (1,322.0) | (743.6) | 16,057.2 |
Fixed assets, borrowings and EPS run as sub-ledgers inside FinConso and feed the statements and notes directly.
Fixed assets, borrowings and EPS, as sub-ledgers with their notes.
| Customer | Overdue $'000 | Predicted pay | Risk | Next action |
|---|---|---|---|---|
| Customer 0318 | 410.0 | 23 days late | High | Call today |
| Customer 0127 | 186.5 | On time | Low | Reminder 1 |
| Customer 0244 | 92.3 | 8 days late | Medium | Deduction review |
Credit decisions, invoices, collections, cash application and deductions in one flow. Customers see and confirm their balances in their own portal.
Get paid faster, with fewer disputes and less manual matching.
| Invoice | Vendor | $'000 | 3-way match | Status |
|---|---|---|---|---|
| INV-88213 | Supplier 0142 | 12.40 | Matched | Approved · run 18 Oct |
| INV-88219 | Supplier 0207 | 8.75 | Qty variance 4% | With buyer |
| INV-88220 | Supplier 0207 | 8.75 | Possible duplicate | On hold |
| BILL-2231 | Supplier 0388 | 1.92 | Non-PO · coded 6105 | Awaiting approval |
Invoices arrive through the vendor portal or the AP inbox, are captured and checked for duplicates, matched to PO and receipt, and routed for approval before the payment run.
Invoices in, matched and approved, and suppliers who can serve themselves.
13-week cash forecastForecastMinimum balance
Bank balances across entities in one view each morning, a rolling forecast built from AR, AP and the plan, and treasury payments with approvals.
Know your cash today, next week and next quarter.
| Line | Q1 | Q2 | Change | Flag |
|---|---|---|---|---|
| Revenue from operations | 471.0 | 493.3 | +4.7% | Below threshold |
| Freight and logistics | 28.4 | 36.9 | +29.9% | Explain |
| Shared services allocation | 11.2 | 15.0 | +33.9% | Explain |
| Finance costs | 13.6 | 12.8 | −5.9% | Below threshold |
Budgets and forecasts consolidate on the same structure as actuals. Movements past the threshold are flagged with a drafted explanation, and covenants are tracked with an alert before a breach.
Budgets, forecasts and the story behind the numbers.
The standards tracker shows what is changing, from when, and which statements and notes it touches. Leases, related party disclosures and statutory formats sit here too, with AI agents and an audit trail across every module.
Standards, disclosures, controls and AI agents working inside the close.
Next step
See the consolidation workflow on a sample group, or run it on a representative sample of your own trial balances.

Demo call

Structured pilot
Not sure which? Book the demo call and we'll tell you whether a pilot makes sense for your group.